Fig. 5.
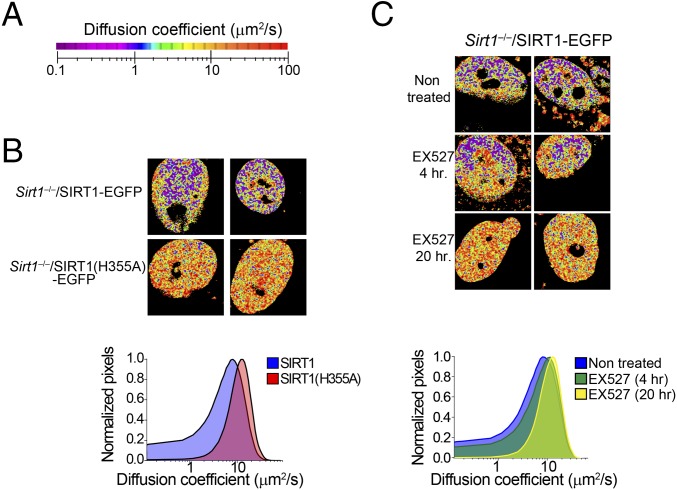
SIRT1 dynamics in the cell nucleus depends on its enzymatic activity. (A) Color scale used to represent the calculated diffusion coefficient of EGFP-fused proteins using the phasor-based fluorescence correlation spectroscopy (phasor fluorescence correlation spectroscopy) technique. (B) Colored images depicting the diffusion rate of SIRT1-EGFP and the catalytically inactive SIRT1(H355A)-EGFP calculated using phasor fluorescence correlation spectroscopy. Two representative images are shown. The histogram in Lower shows the comparison between the diffusion coefficients of two proteins. Mean values are represented from n = 10–15 cells per experiment. Experiments were done in triplicate. (C) Phasor fluorescence correlation spectroscopy-colored images from Sirt1−/−/SIRT1-EGFP MEFs either untreated or treated with the specific SIRT1 inhibitor EX527 (50 μM) during 4 or 20 h. Two representative images are shown. The histogram in Lower represents a comparative analysis between three conditions. Means from n = 10–15 cells are presented. Triplicate experiments were performed.

