Fig. 6.
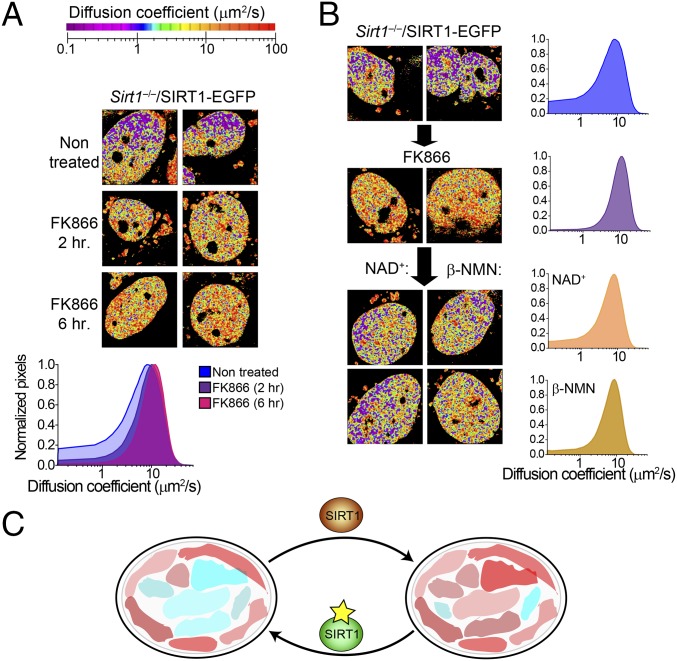
NAD+ metabolism and salvage pathway impact mobility of SIRT1. (A) Phasor fluorescence correlation spectroscopy-colored images from Sirt1−/−/SIRT1-EGFP MEFs either untreated or treated with the specific NAMPT inhibitor FK866 (10 nM) during 2 or 6 h. The histogram in Lower shows a comparative analysis on the diffusion coefficient from three conditions. Means from n = 10–15 cells are presented. Experiments were performed in triplicate. (B) Phasor fluorescence correlation spectroscopy images from untreated Sirt1−/−/SIRT1-EGFP MEFs, which were then treated with FK866 (10 nM) during 6 h. Then, either (Left) NAD+ (2 mM) or (Center) β-NMN (5 mM) was added. Two representative cells are shown for each condition. Histograms in Right represent means from 10 to 15 cells. Triplicate experiments were done. (C) Model illustrating nuclear territories for metabolic states. Bound NADH is represented as red colors, whereas free NADH is shown as blue colors (in the text).

