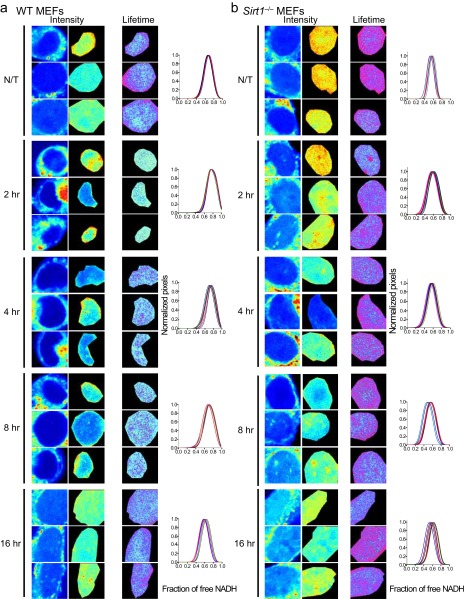
Fig. S2.
Metabolic transitions in the cell nucleus on SIRT1 activation. Intensity and FLIM (lifetime) images in the nucleus from untreated (N/T) (A) WT MEFs and (B) Sirt1−/− MEFs or those treated with SRT2183 (10 μM) for 2, 4, 8, and 16 h as indicated. Three single cells are shown from n = 10–15 cells. Histograms show single-cell NADH lifetime distributions for each experiment. The fraction of free NADH is represented in the x axis, where 1 = 100% free NADH; n = 10–15 single cells per experiment, and each line represents the distribution of the fraction of free NADH for each single cell.

