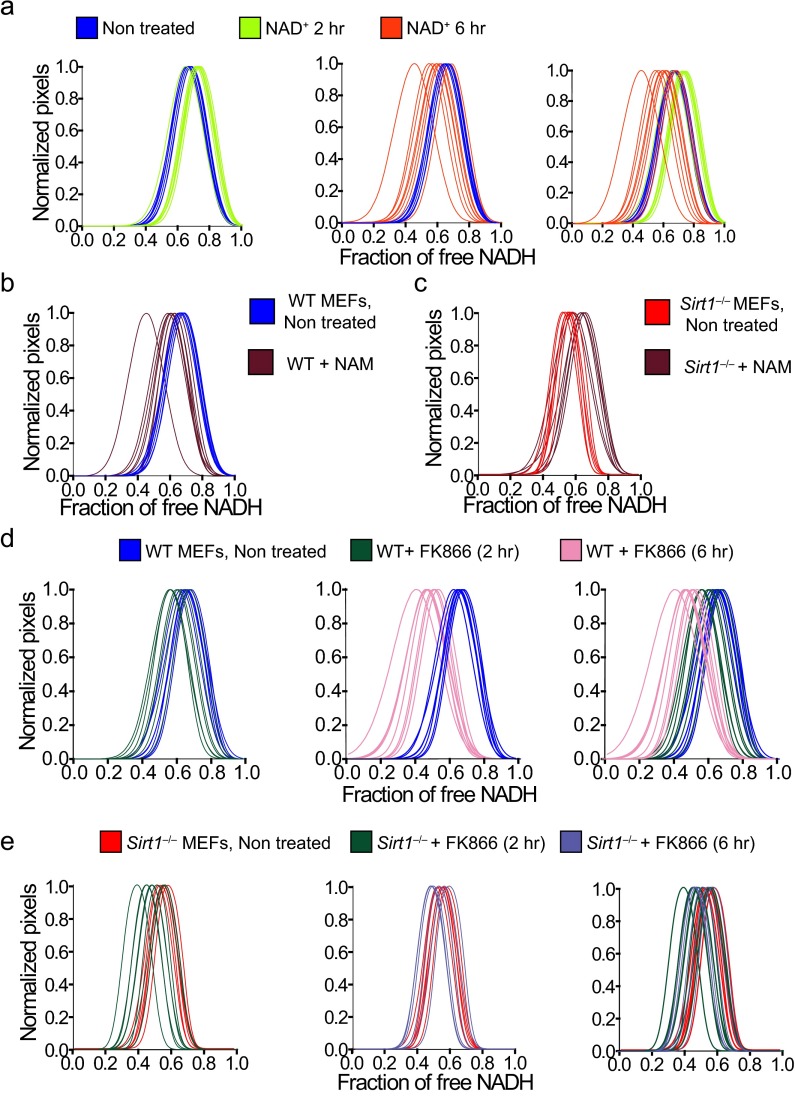
Fig. S4.
NAD+ salvage pathway determines metabolic transitions in the cell nucleus. Histograms showing comparative analyses by overlapping the NADH lifetime distributions from (A, B, and D) WT MEFs and (C and E) Sirt1−/− MEFs nontreated or treated with (A) NAD+ (2 mM), (B and C) NAM (10 mM), and (D and E) FK866 (10 nM). The fraction of free NADH is represented in the x axis, where 1 = 100% free NADH; n = 10–15 single cells per experiment, and each line represents the distribution of the fraction of free NADH for each single cell.

