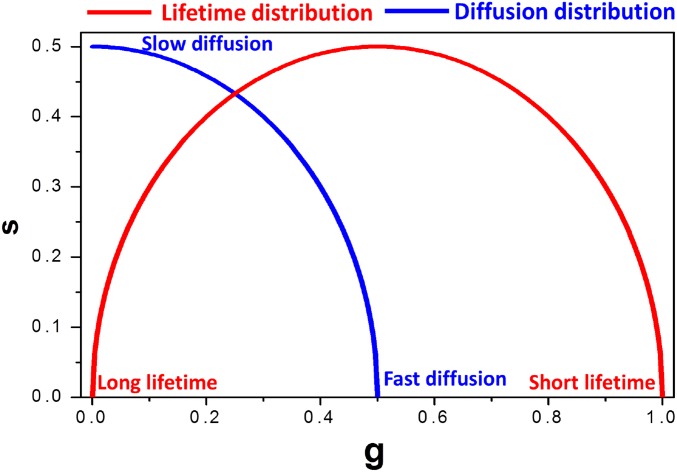
Fig. S8.
Phasor plot diagram. Phasor plot showing the universal circle used for FLIM analyses (red) and phasor fluorescence correlation spectroscopy diffusion calculations (blue). The short and the long lifetimes appear at small and large phase angles along and inside the red circle, respectively. The faster and the slowed diffusing molecules appear at the smaller and larger phase angles, respectively, along the blue semicircle.

