Fig. 1.
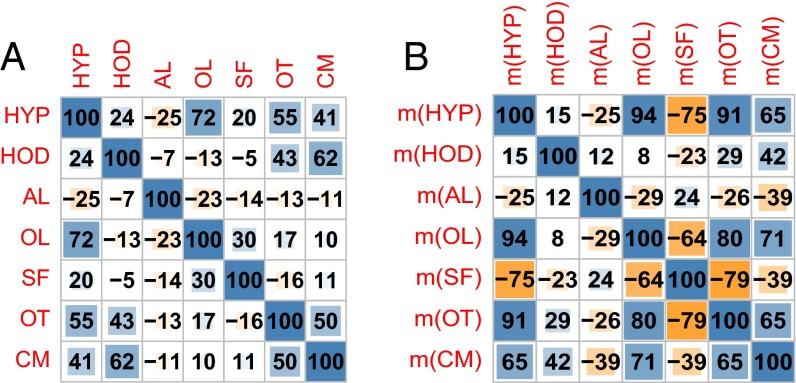
(A) Linear correlations among dental traits at species level (63 observations). Correlations above 0.24 or below −0.24 are statistically significant at 5% via the two-tailed t test. (B) Linear correlations among dental trait means (m) at site level (13 observations). Correlations above 0.55 or below −0.55 are statistically significant. Color-coding: blue, positive correlations; orange, negative correlations. The intensity of the color indicates the strength of the correlation.

