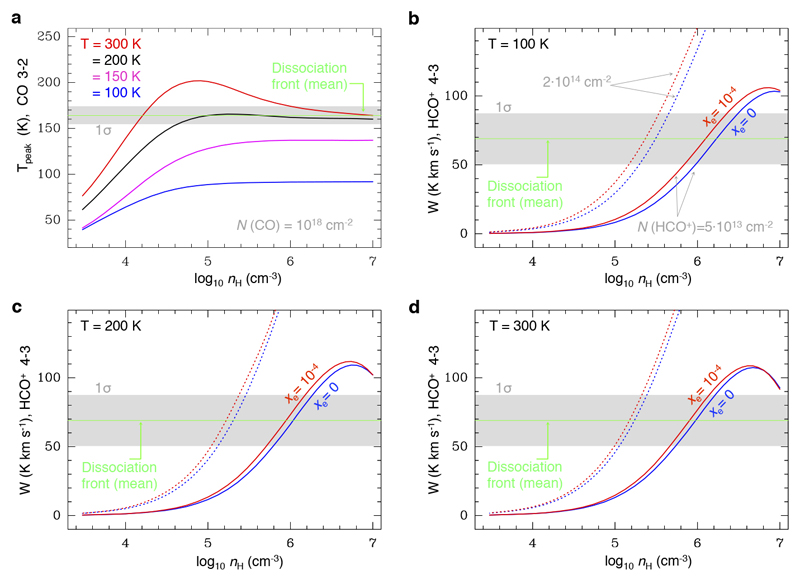
Extended Data Figure 3. Excitation models for different gas temperatures and densities.
a, CO J=3-2 line peak (for N(CO)=1018 cm-2). b, c and d HCO+ J=4-3 integrated line intensity. Each curve represents a different electron abundance model: xe = 0 (blue) and 10-4 (red). Continuous curves are for N(HCO+)=5·1013 cm-2 and dotted lines for N(HCO+)=2·1014 cm-2 (appropriate for deeper inside the Bar, δx>30’’). The horizontal green dashed line represents the average (a) and (b, c, and d) with their standard deviation (grey shaded) towards the dissociation front (at δx≈15’’).

