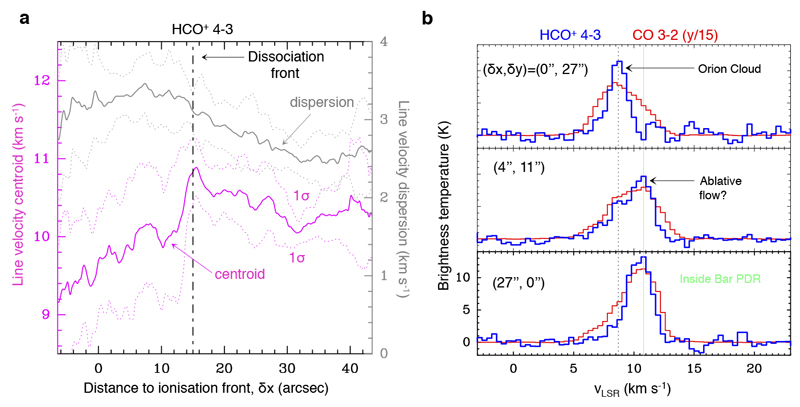
Extended Data Figure 4. Line velocity centroid, dispersion and profiles.
a, Vertically-averaged cuts perpendicular to the Bar in the HCO+ J=4-3 line velocity centroid (magenta curve) and FWHM velocity dispersion (grey curve). b, CO and HCO+ spectra at representative positions. The first two panels (from top to bottom) are positions between the ionisation and dissociation fronts, the third one is inside the molecular Bar. Offsets are given with respect to the rotated images in Extended Data Fig 2. The velocity of the background cloud is vLSR≈8.5 km s-1 (black dashed line), whereas the velocity of the Bar is vLSR≈11 km s-1 (green line).

