
Figure 4.
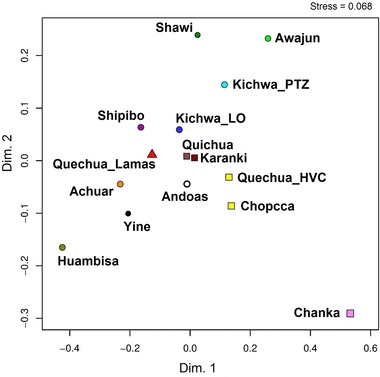
MDS plot for Q‐M3 Y‐STR data among 15 Peruvian and Ecuadorian populations. Reynolds’ Rst genetic distances were used among populations. Amazonian populations are represented by circles, Andean populations by squares and the Quechua‐Lamista population by a triangle.