Figure 5.

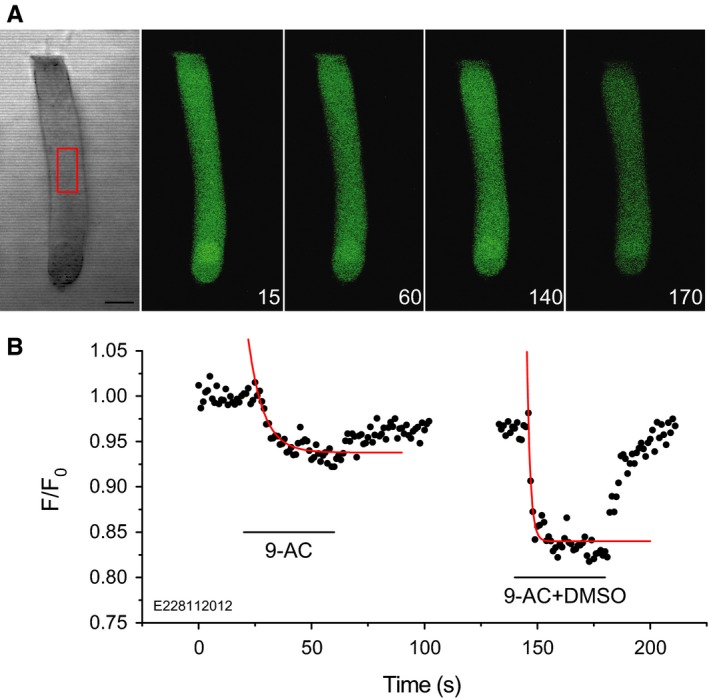
Extracellular 9‐AC reduces intracellular pH. (A) Fluorescence monitoring of the time course of intracellular pH, using the fluorescence dye BCECF, in response to extracellular 500 μm 9‐AC. Numbers in the bottom right corners of the fluorescence images indicate time in seconds. The region of interest indicated by the red rectangle in the middle of the isolated OHC was chosen to calculate fluorescence intensity values, F, normalized to the averaged initial value F0 recorded at the beginning of the experiment. (B) Time course of the relative fluorescence intensity for the cell in A. Including DMSO in the perfusion fluid resulted in a larger and faster fluorescence signal (right panel) than when 9‐AC alone was present (left panel). Red lines indicate single exponential fits with time constants of 6.7 ± 1.1 s and 1.5 ± 0.3 s, respectively, in the absence and presence of DMSO. Scale bar, 10 μm.
