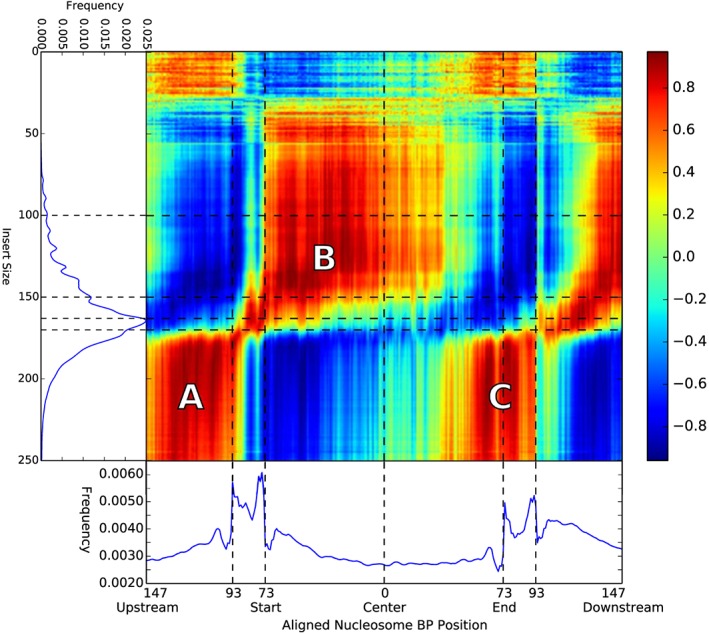
Figure 4.

Correlation per base pair of the aligned nucleosome profile with different fragment sizes in paired‐end data. As clearly visible, larger insert sizes correlate to the regions around the nucleosome positions (marked A), while the first half of the nucleosome covered area (73 upstream to 0 center, marked B) correlates strongly with fragment sizes up to 150 bp. The positive correlation between fragment sizes over 175 and nucleosome position 50–90 bp downstream (marked C) match expectations of cutting behavior when a DNA fragment contains two nucleosomes
