
Figure 4.
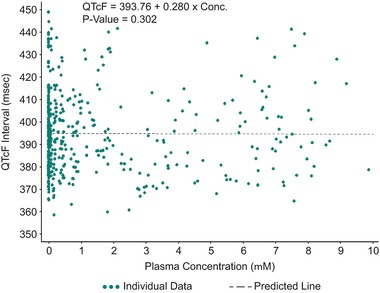
Time‐matched QTcF vs plasma omarigliptin concentration (μM) from subjects in the single ascending dose study, with linear mixed‐effect model fit line.
Official websites use .gov
A
.gov website belongs to an official
government organization in the United States.
Secure .gov websites use HTTPS
A lock (
) or https:// means you've safely
connected to the .gov website. Share sensitive
information only on official, secure websites.
Time‐matched QTcF vs plasma omarigliptin concentration (μM) from subjects in the single ascending dose study, with linear mixed‐effect model fit line.