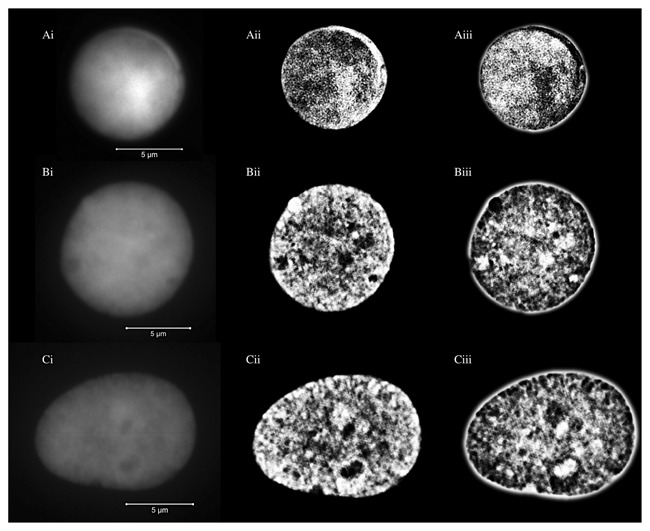
Figure 1.

Representative images from DAPI‐stained nuclei of a normal lymphocyte (A), MGUS nucleus (B) and MM nucleus (C). Widefield images are shown in images (i), unclipped SIM images in images (ii), and negative unclipped SIM images in images (iii). The scale bars are 5 μm in length. The SIM images showed the DNA structures in greater detail compared to the widefield images. Note the difference in the DNA structures and also the size of the nuclei between the different cell types.
