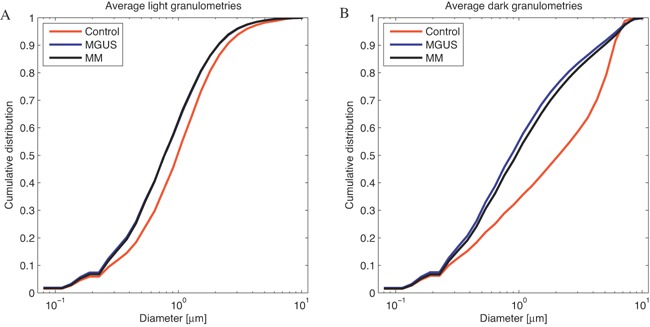
Figure 2.

Measurement of the size distribution of the DNA structure of normal lymphocyte (red lines), MGUS (blue lines) and MM (black lines) using granulometry. While the differences in nucleus size of each cell type might reach up to several μm, the differences in the DNA structure size were represented in the sub‐micron size range. Granulometries revealed a significant increase in the amount of DNA submicron structure in MGUS and MM nuclei compared to control lymphocyte (P = 10−88) (A). The differences between MGUS and MM are significant for DNA‐free space (P = 10−8) but not for DNA submicron structure (P = 0.68) (B). Note that both MGUS and MM nuclei were significantly larger in size than normal lymphocytes.
