
Figure 1.
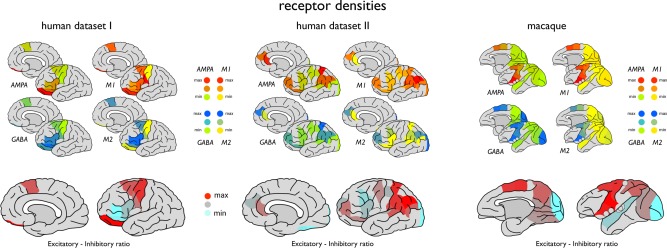
Regional mappings of receptor levels of regions of human cortex as derived from pioneering studies of Amunts et al. [Amunts et al., 2010] (human dataset I, 7 cortical areas, left panels) and Zilles et al. [Zilles et al., 2015] (human dataset II, 18 cortical areas, middle panels) on autoradiography recordings of postmortem cortical tissue. Figures depict measured receptor levels as mapped on the DK‐57 cortical atlas (left hemisphere) depicting levels of excitatory working receptors AMPA and M1 and inhibitory working receptors GABAA and M2. Right upper panel shows regional mappings of receptor levels of excitatory AMPA and M1 and inhibitory GABAA and M2 of 11 regions of macaque cortex mapped to the WBB47 cortical atlas (see text and Supporting Information Fig. 1), as collated from the study of Kotter et al. [Kötter et al., 2001]. Lower panels depict cortical variation in the ExIn ratio between excitatory (AMPA + M1) and inhibitory neurotransmitters (GABAA and M2) for human (left and middle) and macaque cortex (right).