
Figure 2.
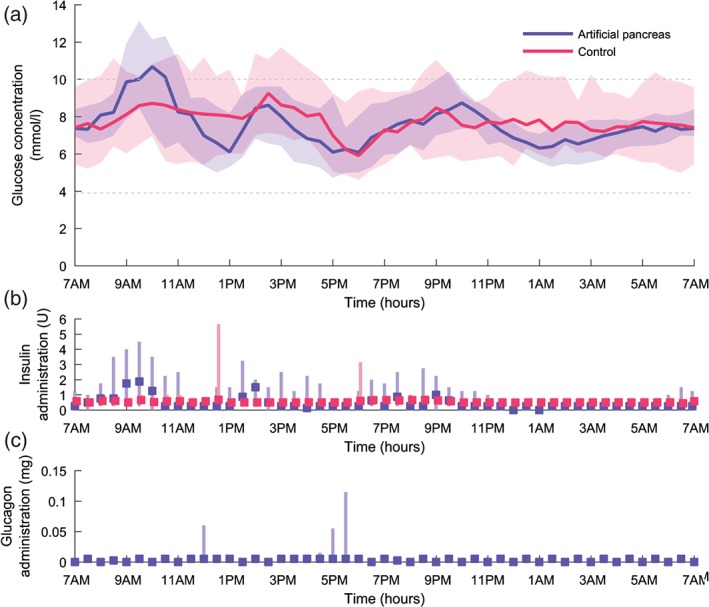
Glucose profile, insulin and glucagon administration over 24 h for the artificial pancreas and control period. For each treatment period this figure summarizes the data of 30 days (3 days for 10 patients). (a) Median glucose profile, the shaded bands indicate interquartile range (IQR). The grey dashed lines indicate the euglycaemic range. (b and c) Median administration (sum per 30 min). The lines indicate IQR.