
Figure 1.
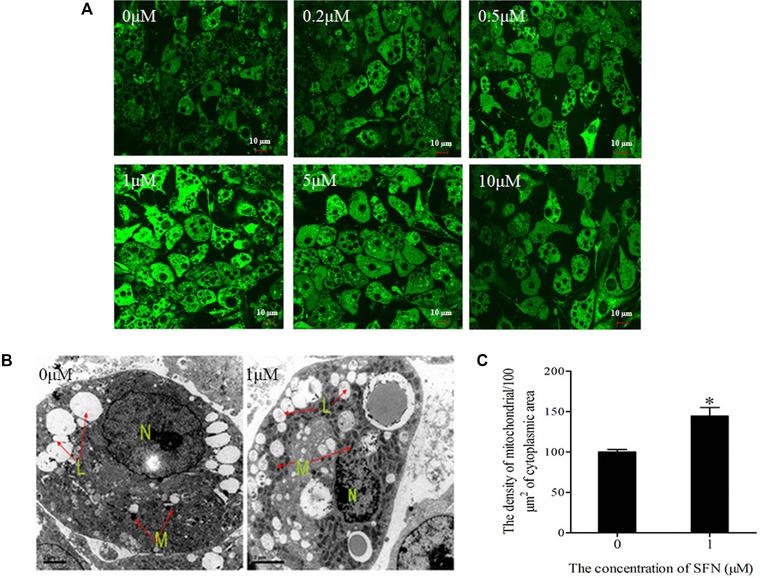
Effect of SFN on the mitochondrial content of mature 3T3‐L1 adipocyte. The cells were treated with 0, 0.2, 0.5, 1, 5, and 10 μM SFN for 48 h. (A) The mitochondrial mass was obtained using the Mitotracker Green stain (magnification, ×60). (B) The mitochondrial ultrastructure image was generated using a transmission electron microscope (magnification, ×5,000). (C) The mitochondria density in adipocytes was detected using a transmission electron microscope. Values indicate means ± SD of six cells. *p < 0.05 compared with the control.