
Figure 2.
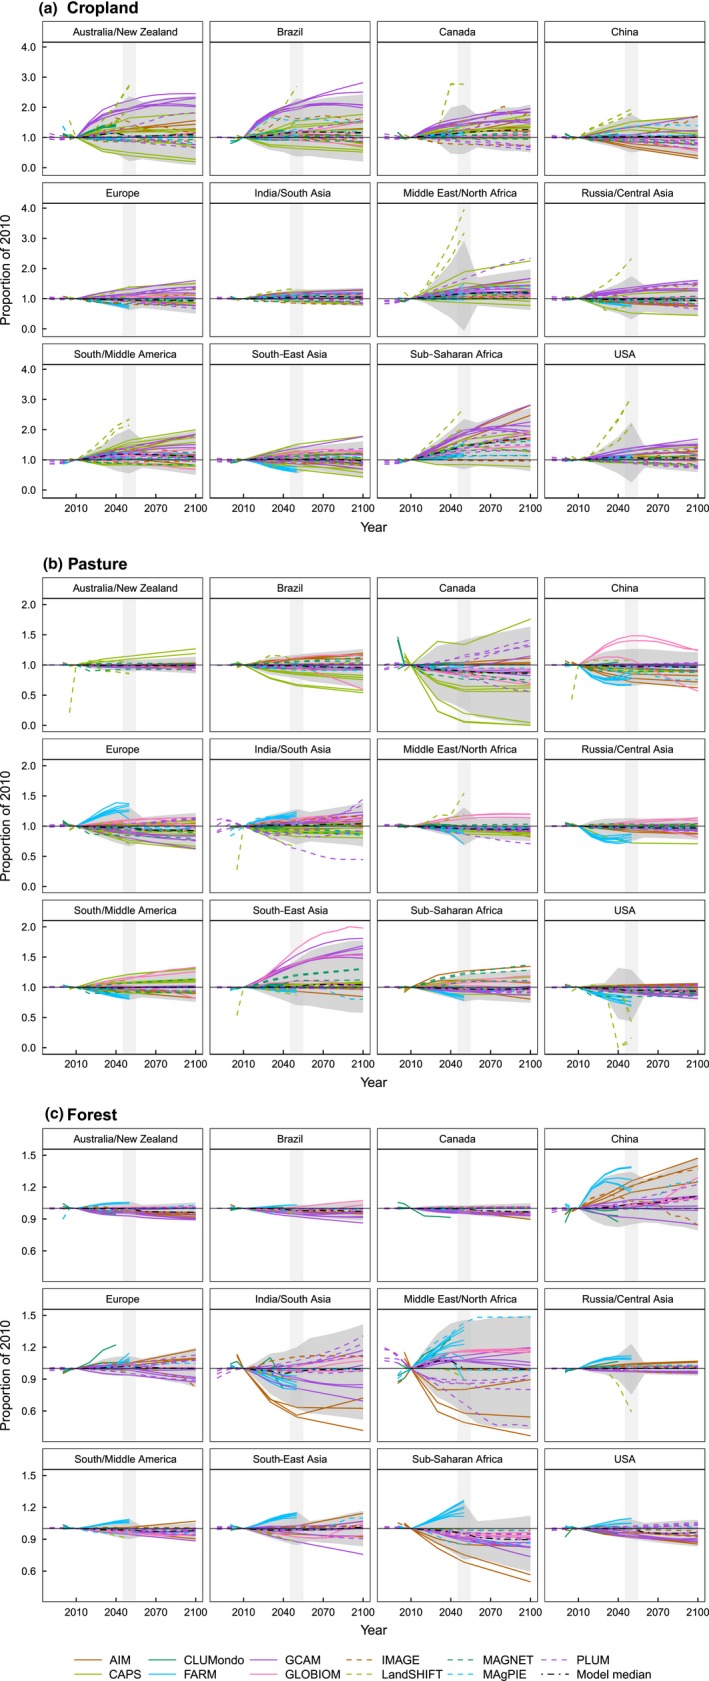
Land‐use and land‐cover change projections for (a) cropland, (b) pasture and (c) forest of 43 scenarios generated by 11 different models. Changes are shown relative to the areas reported in 2010 per category (for original areas projected by the models, see Figure S4). The gray shading represents the 95% interval of model results, while the vertical gray bar indicates a change in the amount of models and scenarios between 2040 and 2060. Note the different ranges of scales applied for cropland, pasture and forest categories.