
Figure 3.
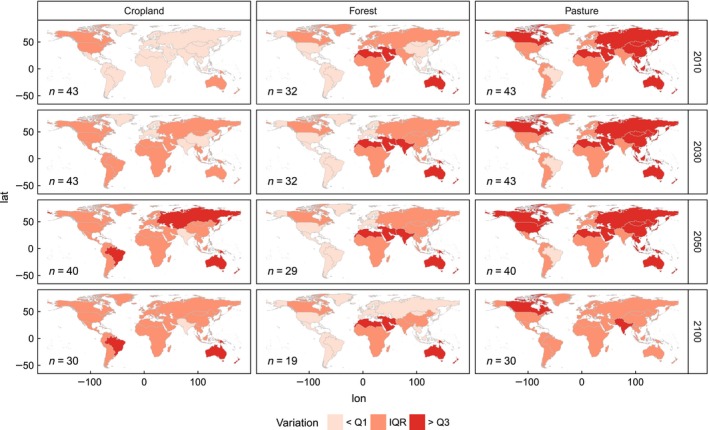
Variation in land‐use areas for 43 scenarios of 11 models in cropland, forest and pasture category; variation expressed as coefficient of variation and classified into lower quartile, interquartile range and upper quartile of the distribution. Quartiles are calculated based on all years and land uses; n depicts the number of scenarios underlying the calculation of COV.