
Figure 4.
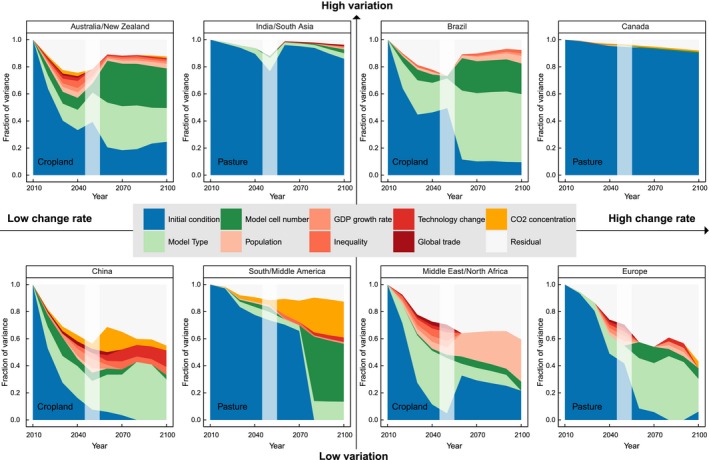
Visualization of variance decomposition for selected regions along the two gradients change rate (horizontal) and variation (vertical). The axes are qualitative based on the distribution of change rates and variation within each LULC type (e.g., Brazil is a representative of high change rates and variations within the cropland category). The order of LULC types within each quadrant is arbitrary. The individual panels show the relative importance of different variance components at each decadal end year. The vertical gray shading indicates a change in the underlying model set between 2040 and 2060.