
Figure 5.
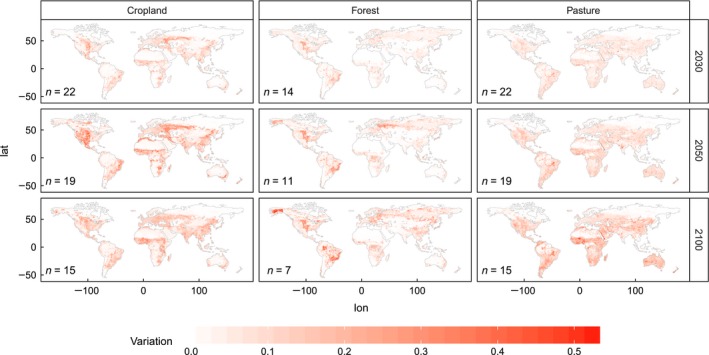
Total variation in net changes (reference year 2010) for cropland, pasture and forest in 2030, 2050 and 2100. The variation is expressed as the standard deviation for each grid cell n depicts the number of scenarios underlying the calculation of standard deviations..