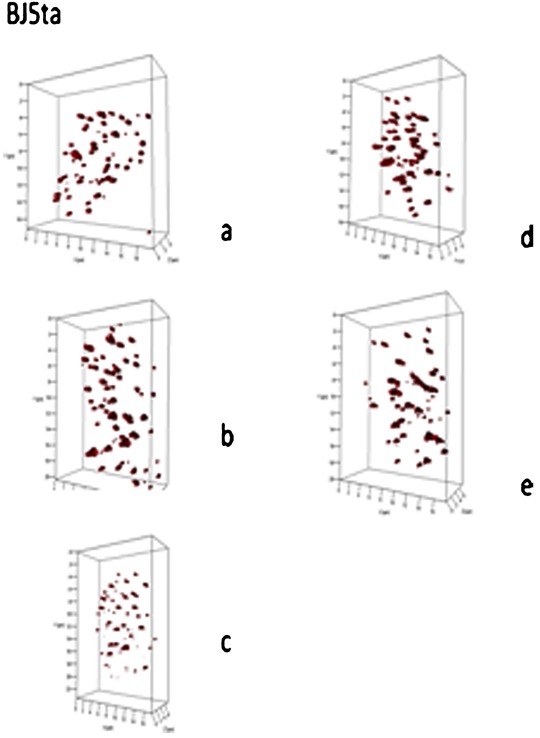
Figure 3.

Three‐dimensional (3D) profiles of telomere organization in representative nuclei from BJ5ta. 3D profiles show telomeric signals (red) in selected nuclei for control cells (a), after DMSO (b), following KPT‐185 (c), KPT‐330 (d), and KPT‐8602 (e).
