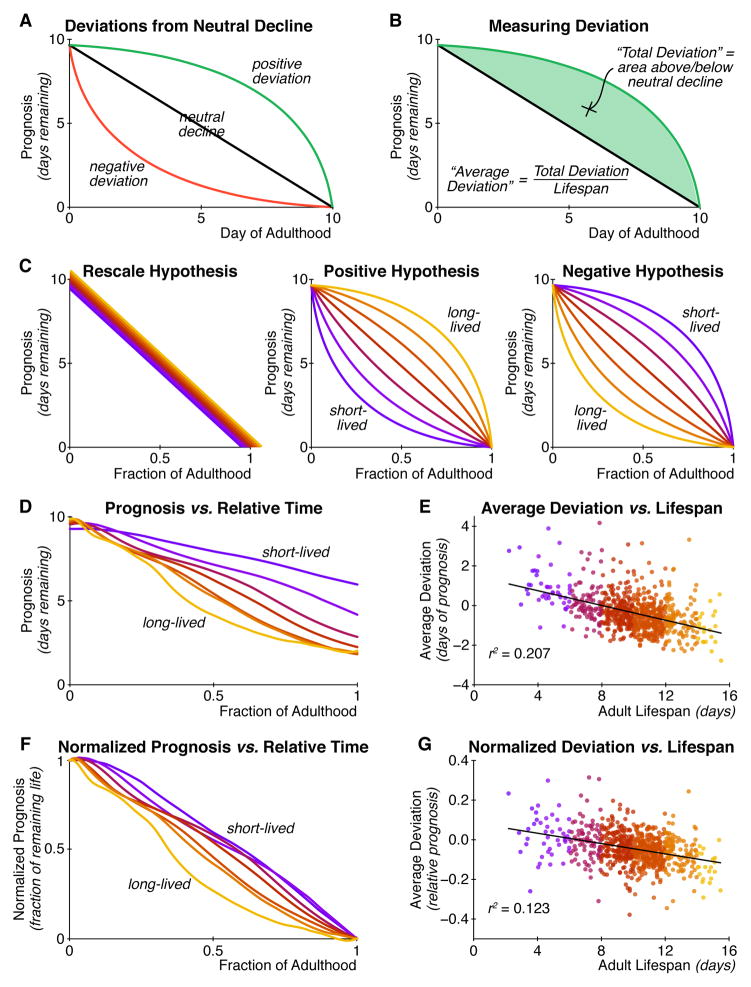
Figure 4. Systematic differences in the trajectories of physiological decline.
(A) The pattern of decline can differ even among individuals with identical lifespans, starting prognoses, and ending prognoses. Individuals may experience senescence evenly throughout life (black; “neutral decline”). Alternately, senescence can accelerate early (red; a “negative deviation”), which produces a relatively extended period of low function. Finally, senescence can be delayed (green; “positive deviation”), leading to a compressed period of low function. (B) We quantify an individual’s trajectory deviation as the area between the actual trajectory (green) and a linear decline (black). This value is positive for trajectories above neutral decline, and negative for those below. To compare individuals with different lifespans, we divide this total area by each individual’s lifespan to produce the “average deviation” throughout life. (C) How trajectories of senescent decline may differ between long- and short-lived individuals. Left: Senescence is identical between long- and short-lived individuals and is merely stretched in time, causing the trajectories to align when plotted in terms of the relative fraction of life elapsed. Middle: Longer-lived individuals might have more positive deviations from neutral declines. Right: Shorter-lived individuals may have more positive deviations. (D) Trajectories of senescence for different lifespan cohorts in relative time. As in the “negative hypothesis”, shorter-lived individuals are systematically healthier at any given fraction of adult lifespan. (E) Lifespan is plotted against “average deviation”, where neutral decline is defined as the straight line between the population mean prognoses at reproductive maturity and death. Longer-lived individuals have negative deviation, while short-lived individuals experience positive deviation. (F) After controlling for differences in starting and ending prognosis, the “negative hypothesis” still applies qualitatively and (G) quantitatively.

