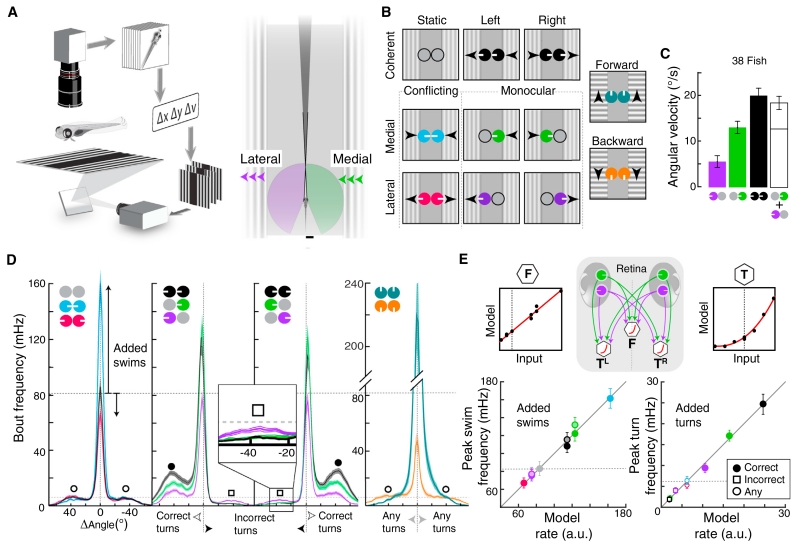
Figure 1. Eye- and Direction-Specific Optic Flow Evoke Distinct Orienting and Locomotion Patterns.
(A) Behavioral setup. Left, freely swimming fish are monitored with a camera while moving gratings are presented. Heading (Δν) and position (Δx, Δy) are extracted to lock visual motion direction to body axis. Right, illustration of each monocular visual field (purple, green, 163°) and the small binocular overlap (dark gray, 12°). Scale bar, 500 μm.
(B) Stimulus set composed of static, medial and lateral motion, and forward and backward stimuli. Arrowheads indicate motion direction. Circular icons represent eyes, and white tick marks show the direction of motion. These icons and colors are used throughout the paper.
(C) Bar graph of average angular velocity (heading direction change per second) during behavioral responses. The white bar represents the linear combination of monocular medial and lateral motion. Error bars are SEM across fish (n = 38).
(D) Average histograms of absolute frequency per swim bout angle. Left, conflicting stimuli affect forward swim frequency (center peak, added “swims”) relative to the static condition (inward versus static, p = 6.6 × 10⁻⁶; outward versus static, p = 7.7 × 10⁻⁸, paired Wilcoxon). Inward reciprocally suppressed turns (open circles). Middle, left/right stimuli increased correct (in motion direction, filled circles) and decreased incorrect (opposite of motion direction, open squares) turn frequency (inset). Medial enhanced but monocular lateral stimuli suppressed swimming (lateral versus static, p = 0.006). Shaded error is SEM, n = 38. Right, forward stimuli increased, backward stimuli significantly reduced forward swim frequency (versus static, p = 2.1 × 10⁻⁶). n = 30.
(E) Comparison of measured bout frequencies and minimal model output. DSRGCs connect to motor centers for forward swimming (F) and left (TL) and right turning (TR). Left, forward swimming. Each point is the mean peak response to a stimulus; lighter center indicates leftward motion. Right, turning behavior. correct turns, filled circles; incorrect turns, open circles; non-directional stimuli, open squares. Model input-output functions for each behavioral component, top right and left. Dotted lines indicate baseline rates.

