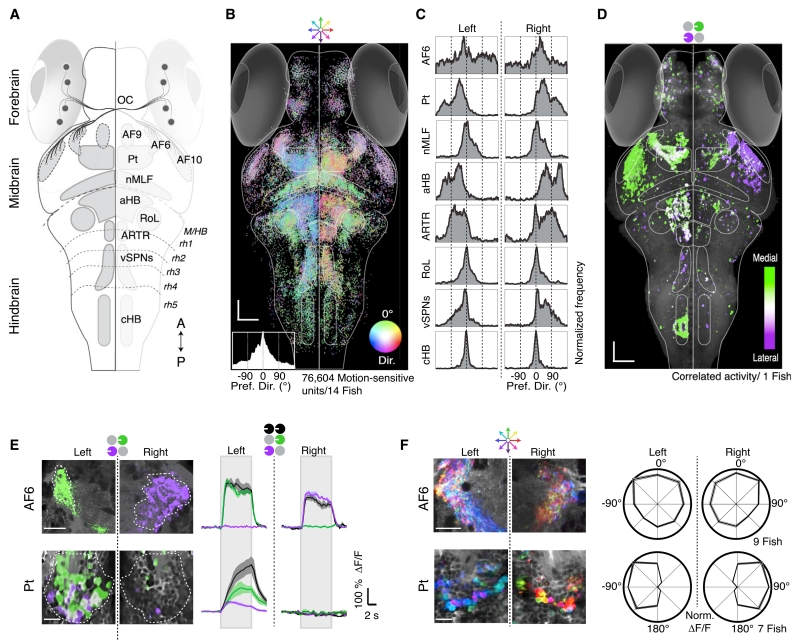
Figure 2. Whole-Brain Activity Maps Reveal Processing Stages Underlying the OMR.
(A) Dorsal overview of zebrafish neuroanatomy. DSRGCs (black dots) project via the optic chiasm (OC) to ten contralateral retinal arborization fields (AFs). Pt, pretectum; nMLF, nucleus of the medial longitudinal fasciculus; aHB, anterior hindbrain; RoL, neurons in rhombomere 1; ARTR, anterior rhombencephalic turning region; vSPNs, ventromedial spinal projection neurons; cHB, caudal hindbrain; M/HB, midbrain-hindbrain border; rh1–5, rhombomeres 1–5. A, anterior; P, posterior.
(B) Distribution of all motion-sensitive units (n = 76,604) across 14 Tg(elavl3:GCaMP5G) fish. Each unit is a dot, color coded for preferred motion direction (see Dir. color wheel). Bottom left, histogram of direction preference. Scale bars, 50 μm.
(C) Histograms of direction preference for specific brain regions.
(D) Binocular activity map generated from sequential presentation of monocular leftward motion to each eye. Pixels are colored for medial versus lateral preference (STAR Methods). Binocular regions appear white. Anatomy in gray.
(E) Left, two-photon micrographs from single AF6 and Pt planes. Right, average ΔF/F for regions of interest (ROIs) (dashed white lines). Gray rectangles indicate stimulus presentation periods. Shaded areas are SEM over n = 10 stimulus repetitions.
(F) Left, responses to eight whole-field motion stimuli, see color wheel, top. Right, polar plots (±SEM, shaded area) of average normalized ΔF/F in n = 7 fish.

