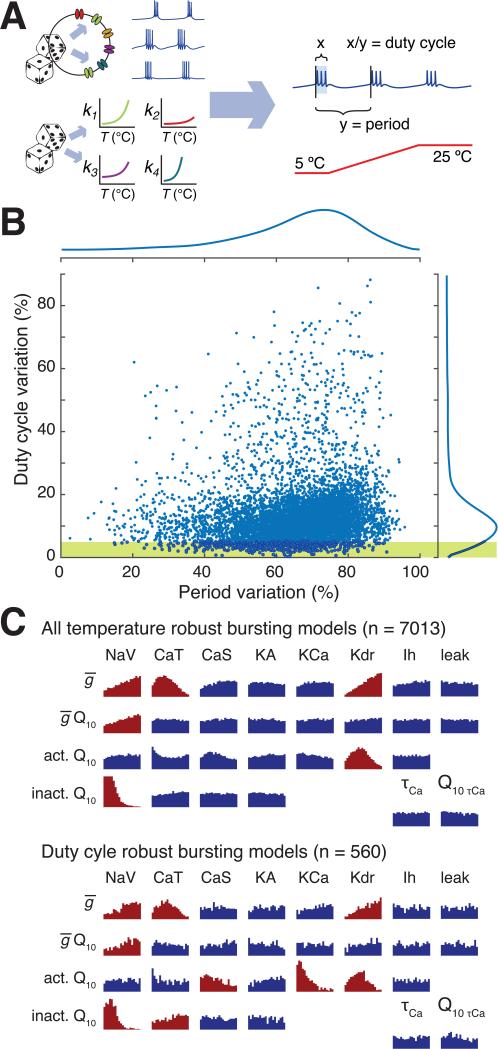
Figure 2. Many sets of conductance densities can produce temperature robust neurons with mismatched Q10s.
(A) Strategy for sampling temperature-robust combinations of channel densities and Q10s. Both channel densities and Q10s were randomly assigned to 116,400 single compartment models, which were then screened to find temperature robust pacemaking activity by measuring duty cycle and burst period during acute temperature ramps (parameters in Supplemental Table S1). (B) Total variation in cycle period and duty cycle over the temperature range 5 – 25 °C for all 7013 models that maintained bursting across temperature. Total variation is defined as the difference between maximum and minimum cycle period/duty cycle across the temperature range. Marginal distributions of period variation and duty cycle variation are shown to the top and right of the plots. Yellow shaded region shows the subset of models that maintained duty cycle within 5% over the temperature range. (C) (Top panel) Histograms of Q10s for all channel gating variables and maximal conductances, and for calcium buffering time-constant and Q10. For maximal conductances, the horizontal axis ranges from 1.0 to 1.5. For calcium buffer time-constant the range is 20-100 ms. For all other Q10 histograms the range is 1.0 to 4.0.
Distributions that deviate substantially from the original uniform sampling distribution are shaded red (Kolmogorov-Smirnov statistic > 0.1.) Conductance abbreviations: NaV = fast sodium, CaT = transient calcium, CaS = slow calcium, KA = A-type potassium, KCa = calcium-activated potasium, Kdr = delayer rectifier potassium, Ih = hyperpolarization-activated mixed cation conductance. (Bottom panel) as for Top panel, but for the subset of 560 models that maintained duty cycle within 5%, as depicted in yellow shaded region of (B).

