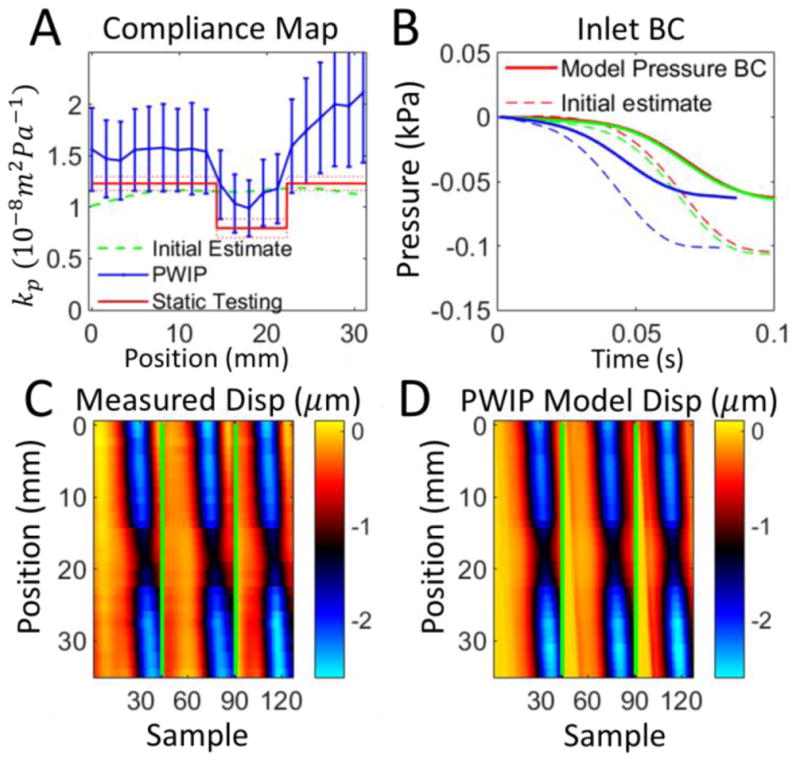
Figure 14.

PWIP across the 7mm inclusion in Phantom 4. Panel A: Although the PWIP (blue) correctly identified the location, contrast and size of the smallest inclusion, the error bars in this case are much wider due to one of the 4 inversions producing a much higher compliance estimate than expected. Compliance is overrestimated by 30–80% compared to static testing. See the caption of figure 8 for an explanation of panels B–D.
