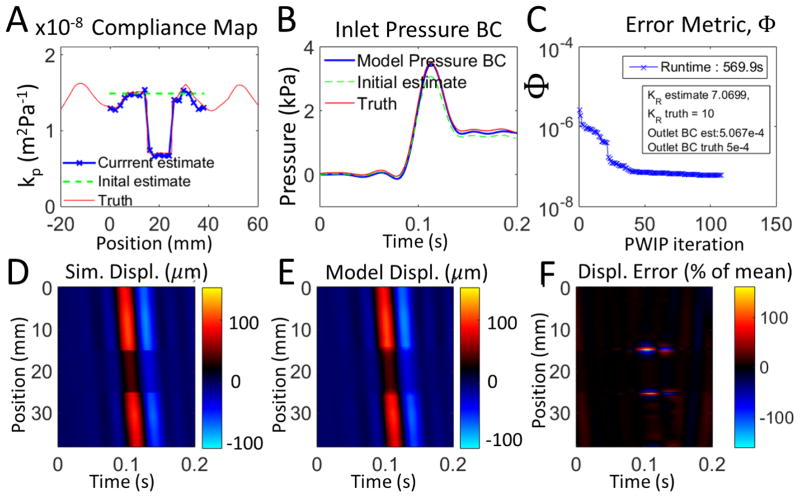
Figure 5.
Inversion of synthetic PWI data with no added noise. Panel A shows that the PWIP recovered the compliance distribution specified in the simulation, and panel B shows that the correct inlet boundary condition was also recovered. Panel C shows the reduction in the error metric (Φ), as well as the recovered values of KR and the outlet BC, R. Panels D and E compare the simulated measured wall displacement data, um with the final model predictions from the PWIP, u(θ) (colormap in units of μm), and panel F shows the relative error between the spatiotemporal maps of panels D and E.

