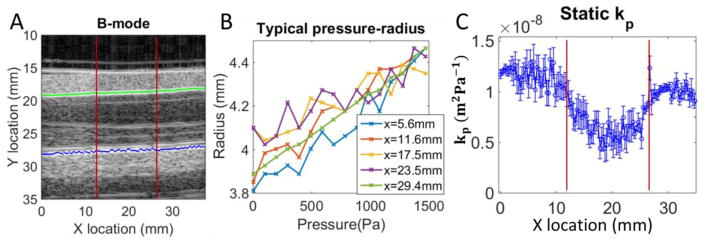
Figure 7.
Example of static pressure testing for a phantom (15mm stiff inclusion centered at x=20mm). Panel A: B-mode image with typical result from automated segmentation algorithm (the green line is the identified top wall, and blue is the bottom wall). The inclusion boundaries are depicted with red lines. Panel B: Pressure radius relationship is approximately linear (a few representative locations are shown). Panel C: Compliance (kp) along the imaged portion, where the error bars are the 95% confidence interval on the linear fit to the pressure-radius curves.

