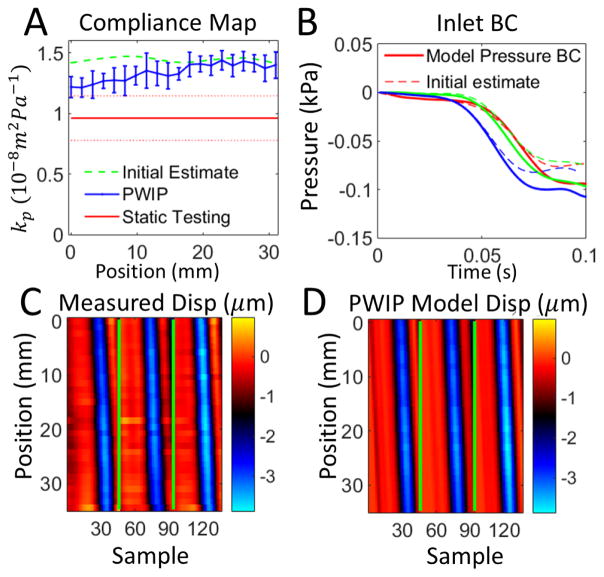
Figure 8.
PWIP results for a homogenous section of soft material from phantom 1. Panel A: The PWIP (blue) correctly identified constant compliance over this section, with an overestimation of around 40% compared to static testing. The error bars are the variation over 4 repeated measurements, and the dotted red lines indicate the uncertianty in the static kp estimate. Panel B: Estimate of inlet boundary conditions (solid) and the initial estimate (dotted) for the first dataset. Each of the three pulses is depicted by a different color. Panels C and D: Comparison of experimentally measured incremental wall dispalcement (C) and the final model wall dispalcements from the PWIP (D) for the first dataset (colormap in units of μm). The green lines separate each of the three pulses.

