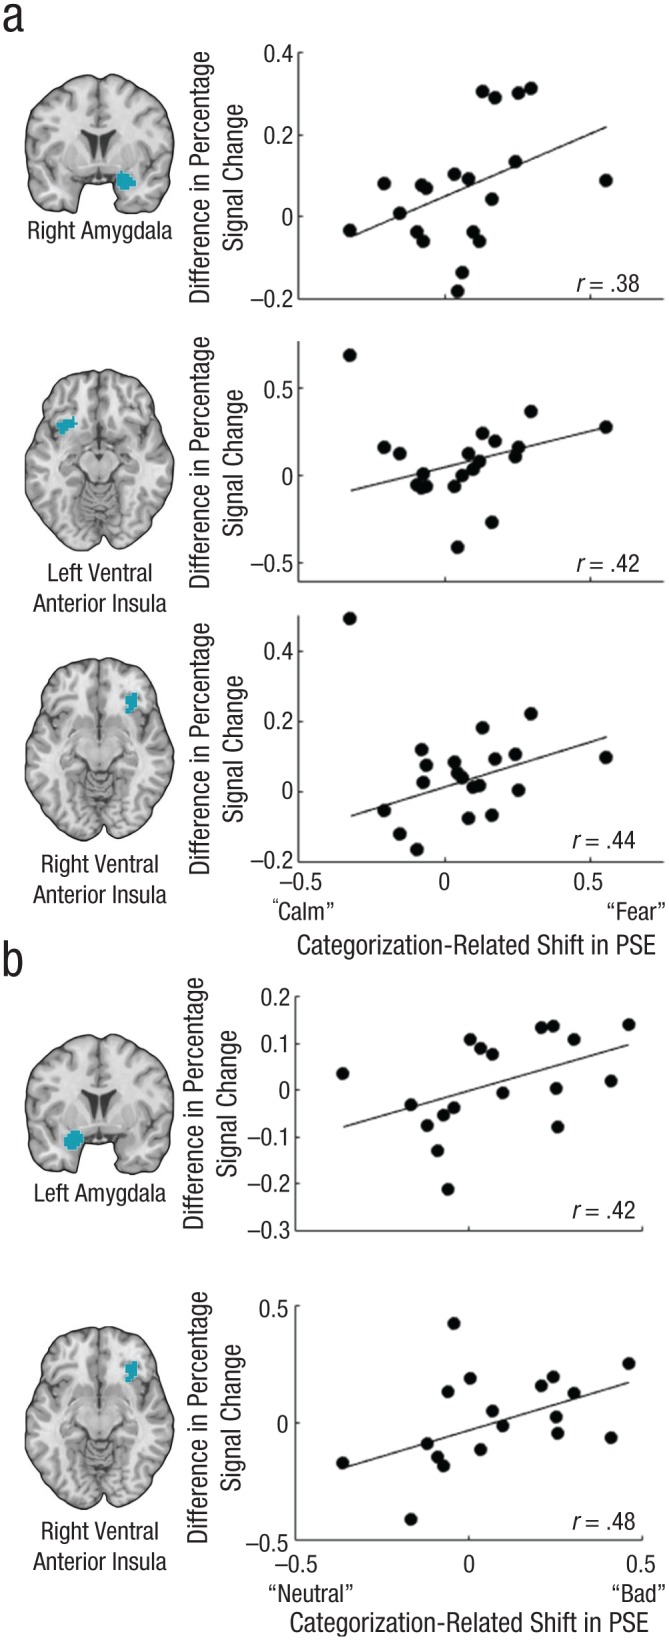
Fig. 4.

Brain images showing regions in which activity correlated with the categorization-related shift in the point of subjective equality (PSE) and scatterplots (with best-fitting regression lines) illustrating those correlations. From top to bottom, the figure shows (a) results for the right amygdala, left ventral anterior insula, and right ventral anterior insula in Study 1 and (b) results for the left amygdala and right ventral anterior insula in Study 2.
