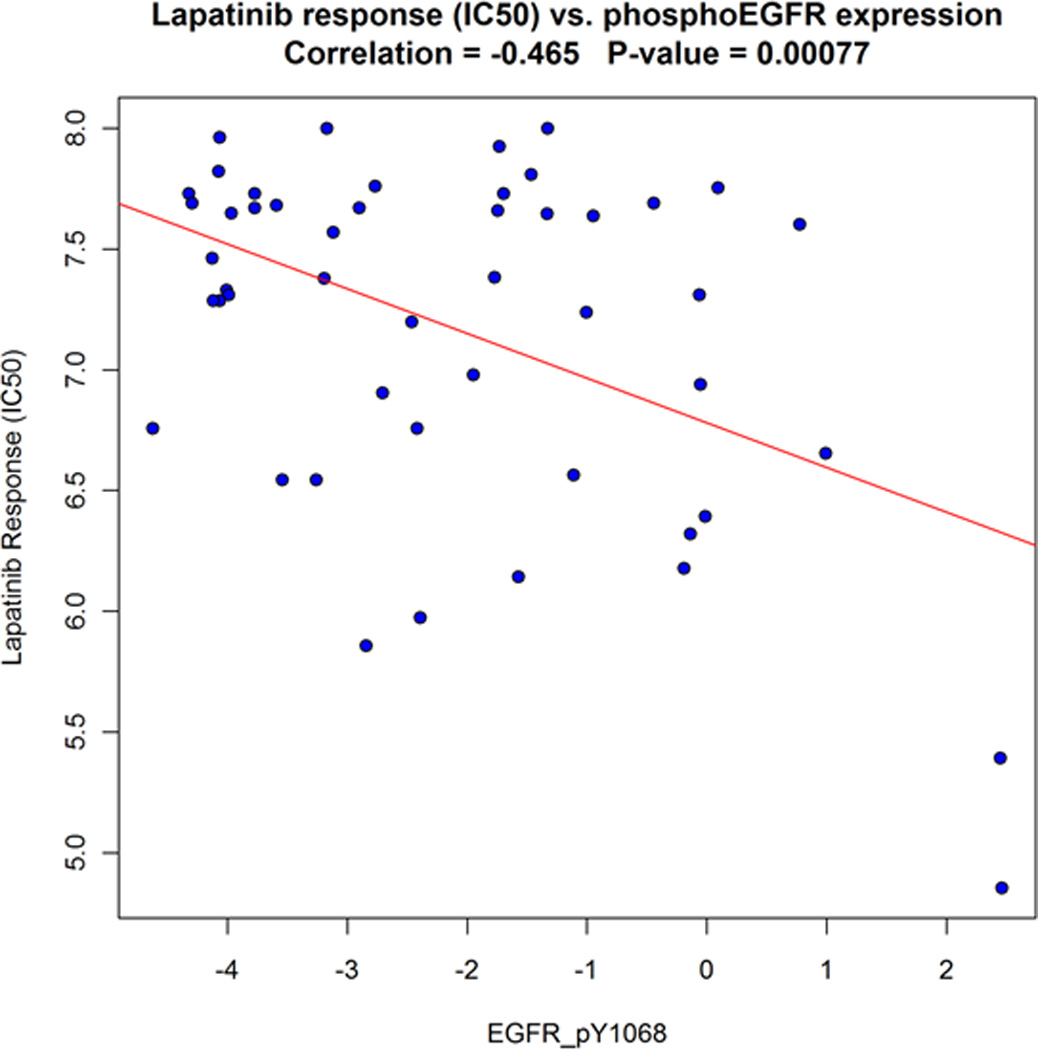
Figure 3.

Response to the drug lapatinib (IC50 values capped at 8.0) vs. phospho-EGFR expression in lung cancer cell lines. IC50 is inversely correlated with phospho-EGFR expression (Pearson correlation = −0.465, P-value = 0.00077), indicating that cell lines with higher expression of phospho-EGFR are more sensitive to the drug. The line of best fit is shown in red. Correlation with these previously-known findings further validate the data produced by the RPPA platform and the methods described.
