
Figure 5.
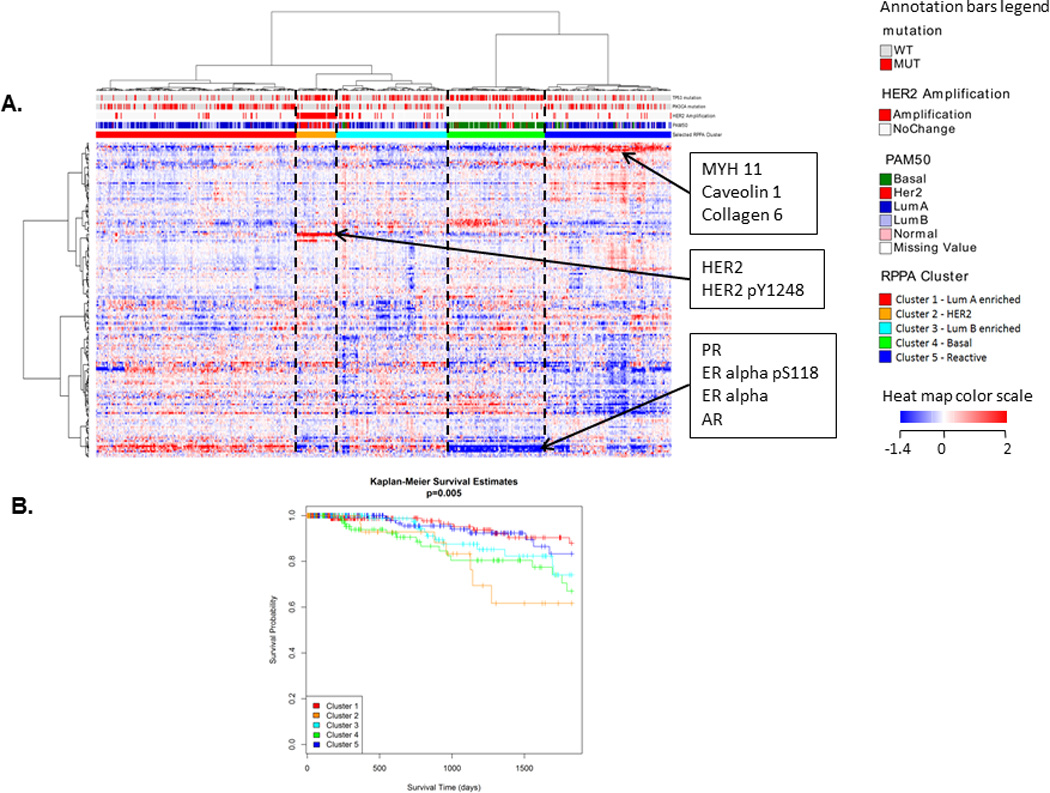
(A) Clustered heat map of TCGA breast cancer RPPA data with samples in columns and proteins in rows. Five different clusters can be seen. The clusters are associated with PAM50 calls, HER2 amplification status, TP53 mutation, and PIK3CA mutation status (p < 0.001, χ2 test). Some known biomarkers can be seen to be differentially expressed between the clusters, such as HER2, phosphoHER2, PR, AR, ER-alpha, and phosphoER-alpha. A newly discovered “Reactive” subtype (cluster 5) based on RPPA data can also be seen with biomarkers MYH11, Caveolin1, and Collagen6. (B) Kaplan-Meier survival curves for the 5 clusters. The Reactive subtype (in dark blue) has good outcome (overall p = 0.005). (Heat map dynamically explorable at: http://bioinformatics.mdanderson.org/TCGA/NGCHMPortal/)