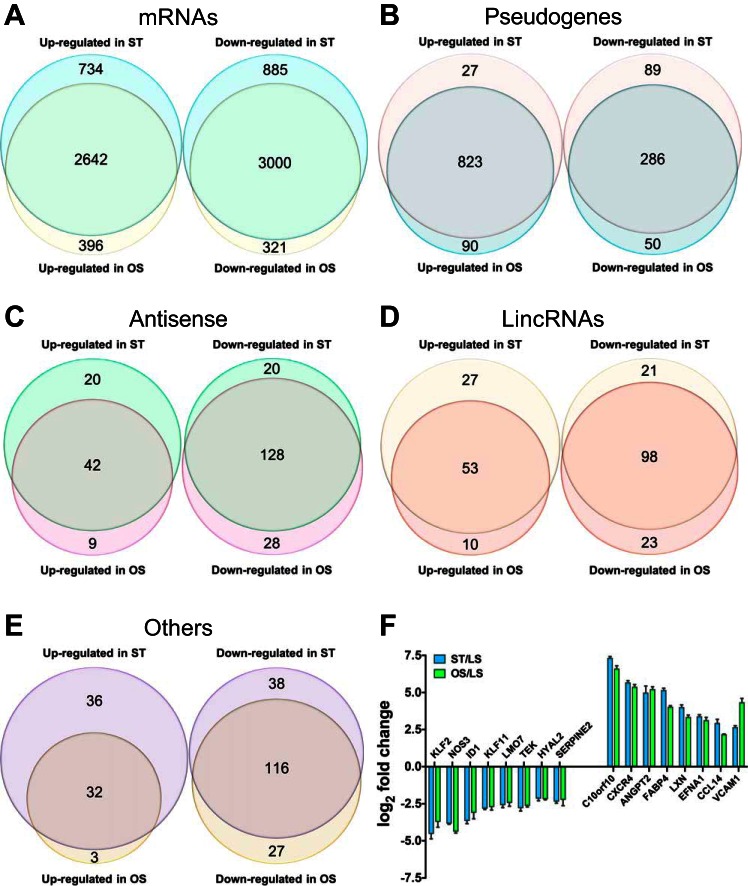
Fig. 2.
A comparison of differentially expressed transcripts under ST and OS. Proportional Venn diagrams of differentially expressed transcripts under OS and ST. Numbers of mRNAs (A), pseudogenes (B), antisense transcripts (C), lincRNAs (D), and others (E) that were differentially expressed in endothelial cels (ECs) under OS and ST conditions compared with laminar sheer stress (LS) conditions. The overlap of 2 circles in each category represents common genes under OS and ST conditions. F: comparison of qPCR results of same genes under ST and OS in Fig. 1, B and C (n = 4, respectively).

