Fig. 3.
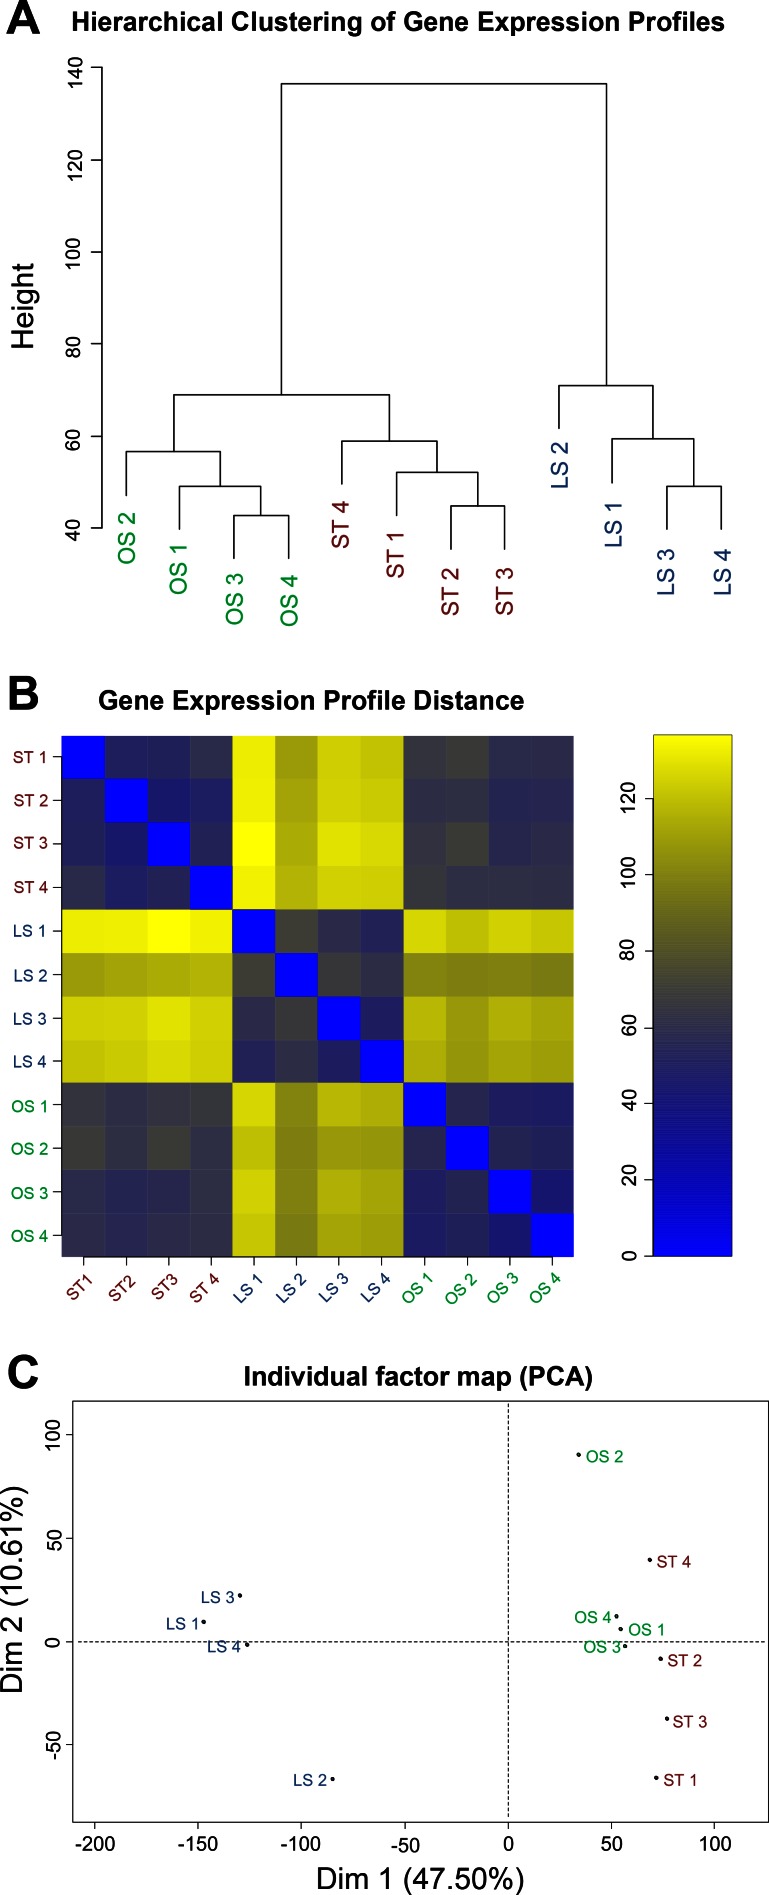
Gene expression profile shows a strong similarity between endothelial transcriptome under ST and OS conditions. A: hierarchical clustering profile reveals detailed relationships between all samples under ST, OS, and LS conditions. The vertical distance reflects the similarity between samples. B: heat map of all 12 samples using Euclidean distance as a measure parameter. C: principal component analysis of gene expression profiles from each sample under ST, OS, and LS demonstrates the major components (Dim 1 and 2) of the variance to separate samples. Dim 1 and Dim 2 account for 47.5% and 10.61% of the total variance, respectively.

