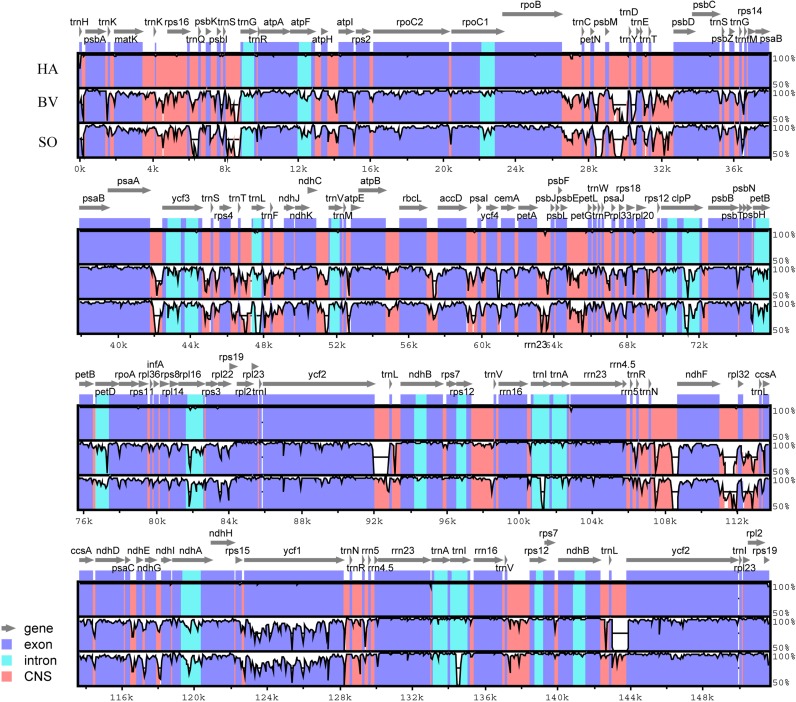
Figure 2. Identity plot comparing the chloroplast genomes of four Amaranthaceae species using Haloxylon ammodendron as a reference sequence.
The vertical scale indicates the percent identity, ranging from 50% to 100%. The horizontal axis indicates the coordinates within the chloroplast genome. Genomic regions are color coded as protein-coding, rRNA, tRNA, intron, and conserved non-coding sequences (CNS). Abbreviations HP, H. persicum; SO, Spinacia oleracea; BV, Beta vulgaris subsp. vulgaris.

