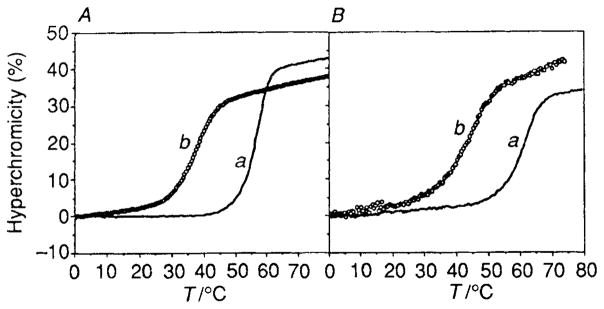
Fig. 1.
UV absorbance melting curves (260 nm) for the circle complexes and for the corresponding duplexes. Each oligomer strand was present at 3 μmol dm−3 concentration, in a buffer of 100 mmol dm−3 NaCl, 10 mmol dm−3 MgCl2, and 10 mmol dm−3 Tris · HCl (pH 7.0). (A) Complex of circle 1 with d(A)12 (a) compared with duplex d(T)12 · d(A)12 (b). (B) The circle 2 complex with d(AAGAAAGAAAAG) (a) in comparison to the duplex d(CTTTTCTTTCTT) · d(AAGAAAGAAAAG) (b).

