
Figure 4.
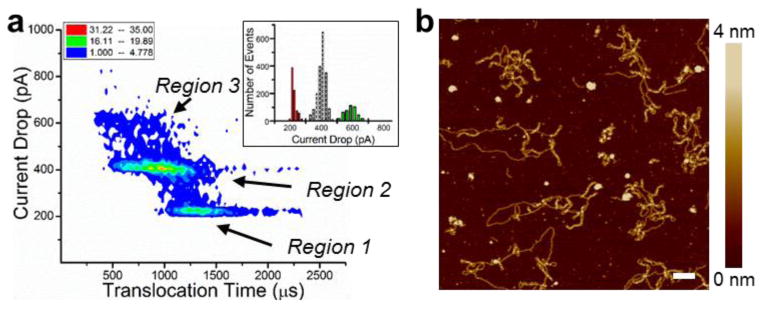
Intercalation of ethidium bromide induces significant changes in the translocation and DNA structure. (a) The density plot of the intercalated (0.5 μM EtBr) circular DNA translocations reveals four discrete DNA conformations. The histogram shows only three populations. (b) AFM height images of circular DNA after treatment with ethidium bromide (initial EtBr concentration ∼0.1 μM) exhibit significant branching structures. Horizontal scale bar is 100 nm. A large area AFM image and height profiles are shown in Figure S2b and Figure S3 (Supporting Information) respectively.