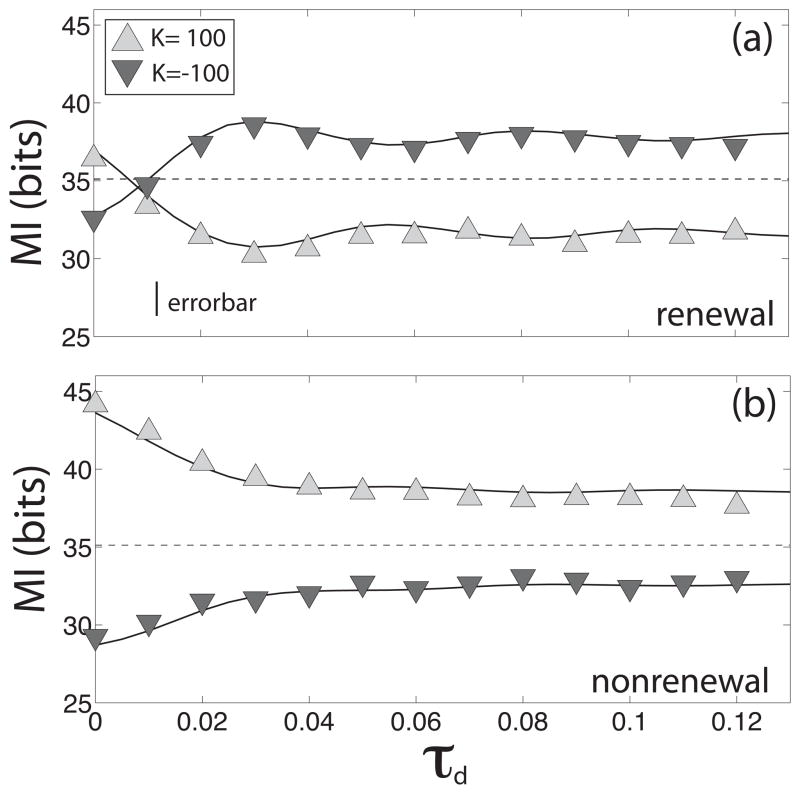
Figure 6.
Mutual information rate MI as a function of delay time for a neuron in a renewal network, (a), and one in a nonrenewal network (b). Symbols show the numerical simulations and the solid line the theoretical results. Triangles up represent excitatory coupling and triangles down inhibitory coupling. Dashed line represents the value of the MI when the network is uncoupled. Other parameters have the same value as in figure 5.

