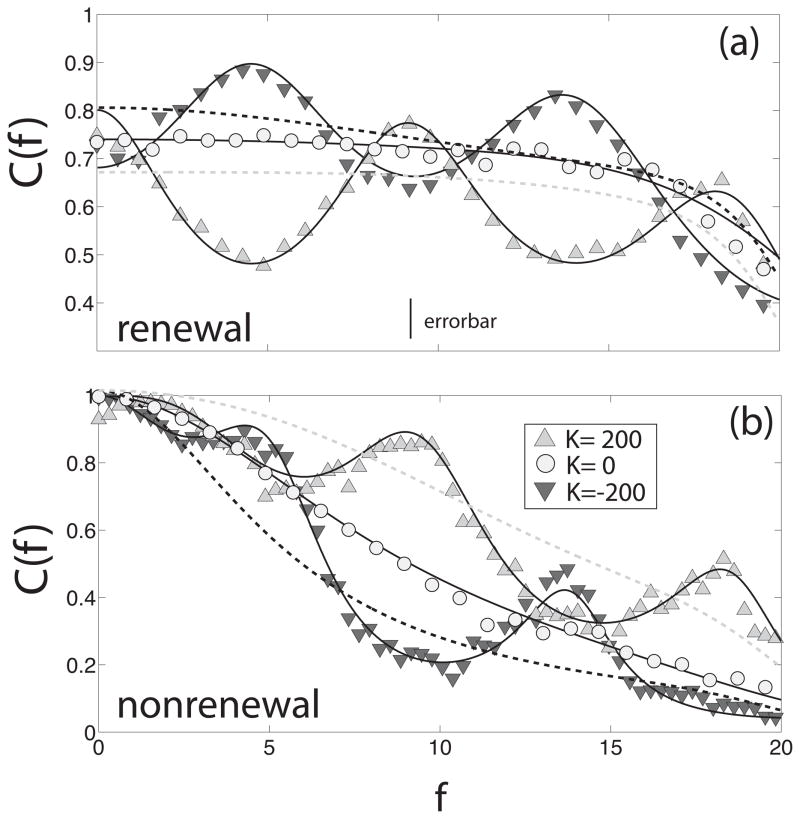
Figure 7.
Coherence C(f) of a single neuron in a network of renewal (a) and nonrenewal (b) neurons with a fixed delay τd = 0.1 for different values of the coupling strength K, inhibitory coupling (dark triangles down), zero coupling (circles) and excitatory coupling (light triangles up). Other parameters have the same value as in fig 5. In both (a) and (b), the dashed lines show the coherence for τd = 0 and inhibitory (black) and excitatory (gray) coupling. Whereas the resonance due to the coupling happens at the same frequency for both models, excitatory coupling tends to increase the coherence for the nonrenewal model as compared to zero coupling whereas the coherence decreases for the renewal model when coupled with excitation. The story is opposite for inhibitory coupling.

