Figure 3.
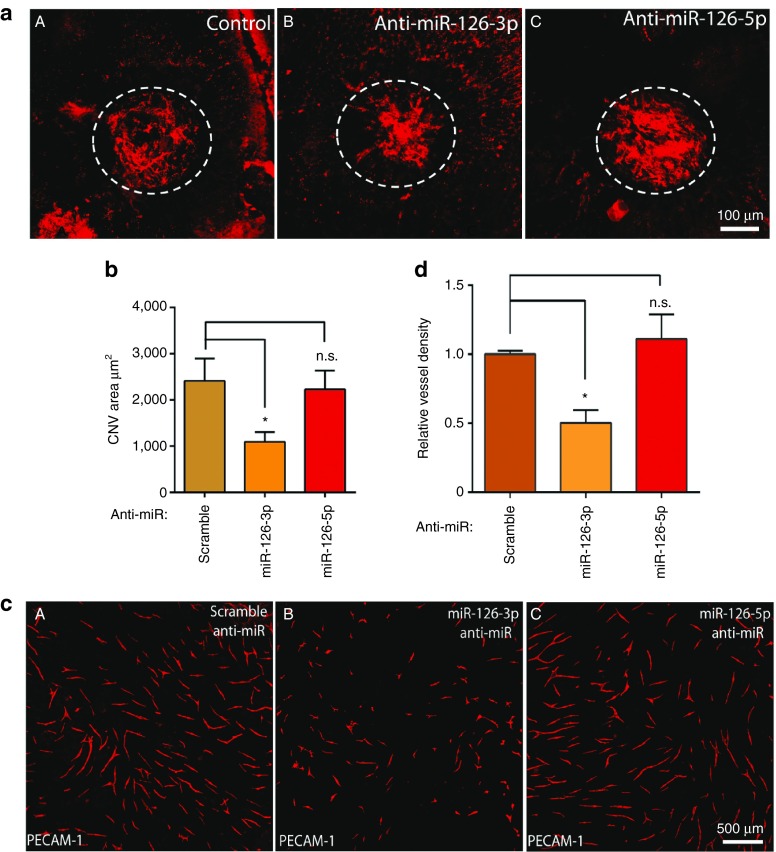
Repression of laser-induced CNV and angiogenesis by miR-126-3p. (a) Representative images of RPE/choroid flatmount after ICAM-2 staining showing repression of laser-induced CNV by LNA-antimiR-126-3p but not LNA-antimiR-126-5p. Scale bar equals 100 µm. Circled regions are the CNV areas. (A) Control; (B) LNA-antimiR-126-3p; (C) LNA-antimiR-126-5p. (b) Quantification of CNV area in a. N.S., not significant; *, P < 0.05. (c) Representative images of vessel-like structures as stained by PECAM-1 in an EC-fibroblast co-culture assay after silencing of miR-126-3p or miR-126-5p in ECs. (A) Control; (B) LNA-antimiR-126-3p; (C) LNA-antimiR-126-5p. Scale bar equals 500 µm. (d) Quantification of vessel density EC-fibroblast co-culture assay after silencing of miR-126-3p or miR-126-5p. *, P < 0.05; N.S., not significant.

