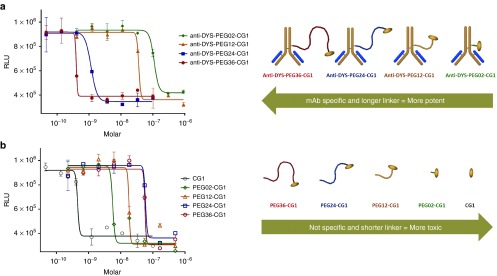
Figure 2.
Effect of linker length on EDC activity. (a) Dose response curves of A549 cells treated with EDCs constructed with the anti-dysadherin (DYS) antibody linked to CG1 via four different polyethylene glycol (PEG) linkers with 2 (green diamond), 12 (gold triangle), 24 (blue square), or 36 (red circle) repeating units spanning different lengths (27, 56, 105, 144 angstroms respectively as measured by bond distances). The figure to the right of the graph represent the 4 EDCs in order of activity from higher activity to lower activity (left to right). (b) Dose response curves of A549 cells treated with CG1 (black open circle) and 4 the different Linker-CG1s (polyethylene glycol (PEG) polymers with 2 (open green diamond), 12 (open gold triangle), 24 (open blue square), or 36 (open red circle) repeating units spanning different lengths (27, 56, 105, 144 angstroms respectively as measured by bond distances). The figure to the right of the graph represent the four Linker-CG1s in order of activity from higher activity to lower activity (left to right). Based on linker length, notice how the activities of the EDCs are reversed when compared to the Linker-CG1s.

