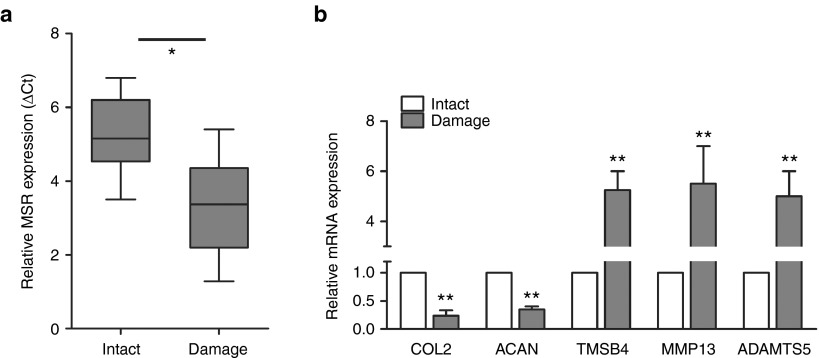
Figure 1.
The differentially expressed genes in the different cartilage regions. (a) The expression of lncRNA-MSR was analyzed using quantitative polymerase chain reaction (qPCR). The ΔCt values were used to measure gene expression, which was normalized to the expression level of GAPDH. (Intact region group = 50, damaged region group = 50, *P < 0.05, **P < 0.01). (b) The expression of TMSB4, COL2A1, ACAN, MMP13, and ADAMTS5 were analyzed using qPCR. The results are shown as the mean ± standard error of the mean of at least three independent experiments (*P < 0.05, **P < 0.01).

