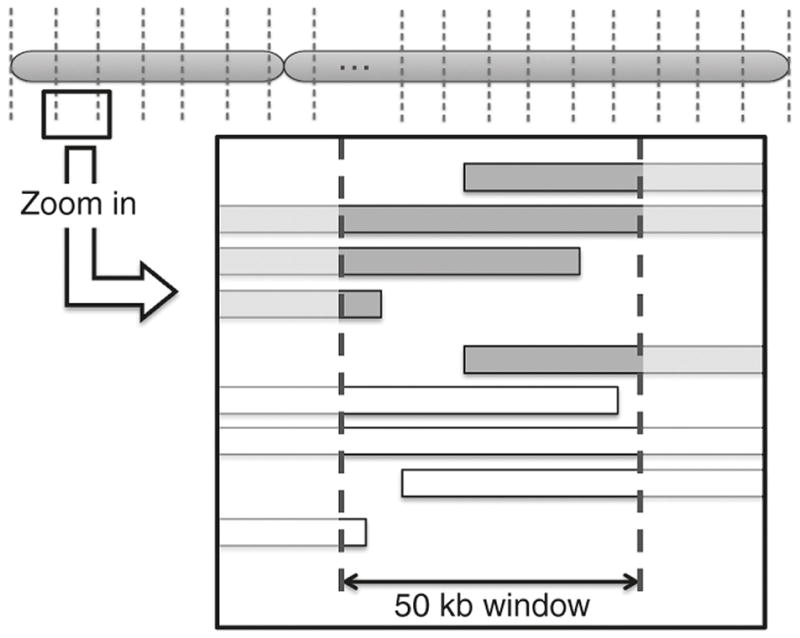
Figure 1. Schematic of ROH Analysis.

Each chromosome (chr 1-22) was split into 50 kb wide windows. The number of minimum final segments of 2000 kb ROH blocks from cases and controls that fell into these sectors was analyzed for differential abundance by Fisher’s exact test. Cases were represented in gray colored bars and controls were represented in white colored bars.
