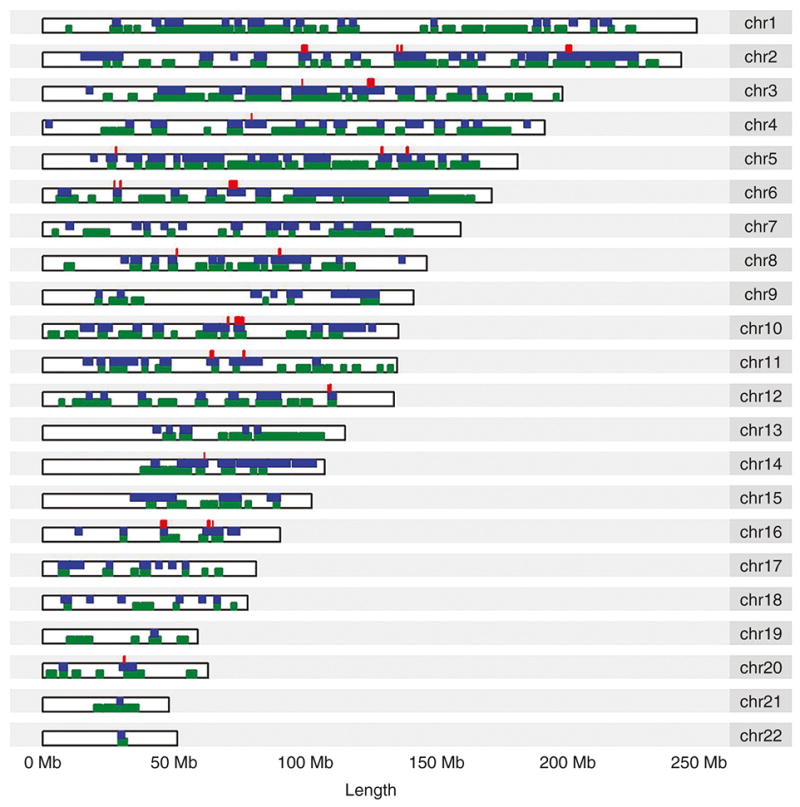
Figure 3. Chromosomal distribution of ROH and 50 kb significant windows.

Green colored regions represent presence of a 2000 kb or greater ROH in at least one TERM patient. Blue colored regions represent presence of a 2000 kb or greater ROH in at least one PRETERM patient. 424 50 kb significant windows are marked in red.
