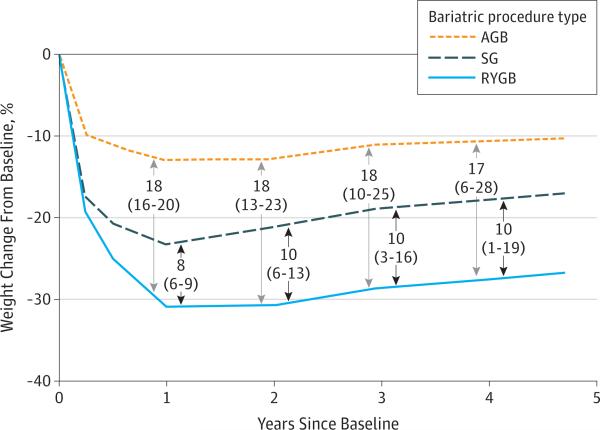
Figure 3. Differences in Estimated Percentage of Weight Change From Baseline by Surgical Procedure Type.
Estimated values, differences, and 95% CIs (shown in parentheses) were generated from a penalized spline mixed-effects model (2410 patients: 246 in the adjustable gastric banding [AGB] group, 379 in the sleeve gastrectomy [SG] group, and 1785 in the Roux-en-Y gastric bypass [RYGB] group). Numbers and arrows in the center of the figure represent the differences and 95% CIs of the differences between the AGB and RYGB groups (top) and the SG and RYGB groups (bottom) at years 1, 2, 3, and 4. The sample for whom there was follow-up weight data for each year and procedure are as follows: year 1, n = 2373 patients (244 patients undergoing AGB, 374 patients undergoing SG, and 1755 patients undergoing RYGB); year 2, n = 2300 (237 patients undergoing AGB, 363 patients undergoing SG, and 1700 patients undergoing RYGB); year 3, n = 2183 (230 patients undergoing AGB, 325 patients undergoing SG, and 1628 patients undergoing RYGB); and year 4, n = 1845 (202 patients undergoing AGB, 181 patients undergoing SG, and 1462 patients undergoing RYGB).

