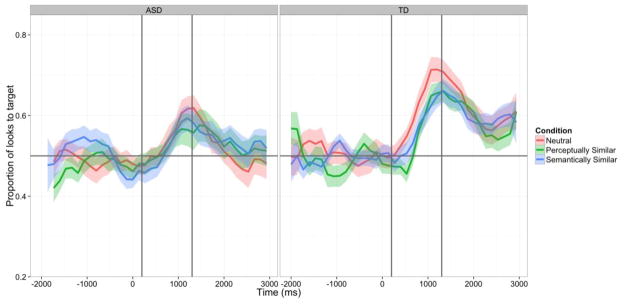
Figure 2.
Time course data for the ASD group (left panel) and TD group (right panel), averaged across trials and children. Error bars indicate +/− one standard error of the mean. The y-axis is mean accuracy (looks to target / looks to target and distractor). The x-axis is time in ms, with 0 indicating the onset of the target noun. The horizontal grey line indicates y = .5, which represents equal looking to target and distractor. Vertical grey lines indicate the test window (300ms to 2000ms after noun onset). Neutral condition data are in red, Perceptually Similar data are in green, and Semantically Similar data are in blue.

