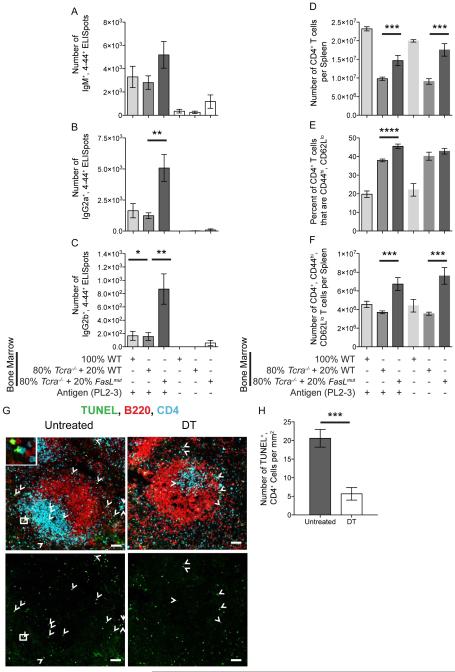
Figure 7. Regulation of AM14 Plasmablasts by cDCs Requires T Cells Expressing FasL and Increases the Death of CD4 T Cells.
(A-F) Experiments performed as described and arranged in same order as in Figure 6, except BM was mixed from WT, Tcra−/− or FasLmut mice. Data were combined from 2 experiments to obtain 6-12 mice per group receiving PL2-3 and 3-8 controls.
(G & H) As described in Figure 1, CD11c-DTR.BALB/c BM chimeras were generated and depleted of cDCs using 16 ng per g weight doses of DT. 8 × 10⁶ AM14.BALB/c B cells were transferred and activated with PL2-3. Spleens were harvested on day 7. Data for untreated versus DT-treated mice are shown. (G) Representative histology of the spleen, taken at a magnification of 200x. Arrowheads indicate TUNEL+, CD4+ cells. Inset upper left shows a digital magnification of a TUNEL+ CD4+ cell in the white box of the larger image. Scale bars are 50 μm. (H) Quantification of TUNEL+, CD4+ cells from a total of 8 fields combined from 2 representative mice per group. Bars represent mean and SEM. *p < 0.05; **p < 0.01; ***p < 0.001 by Mann-Whitney U test.
See also Figures S6 and S7.

