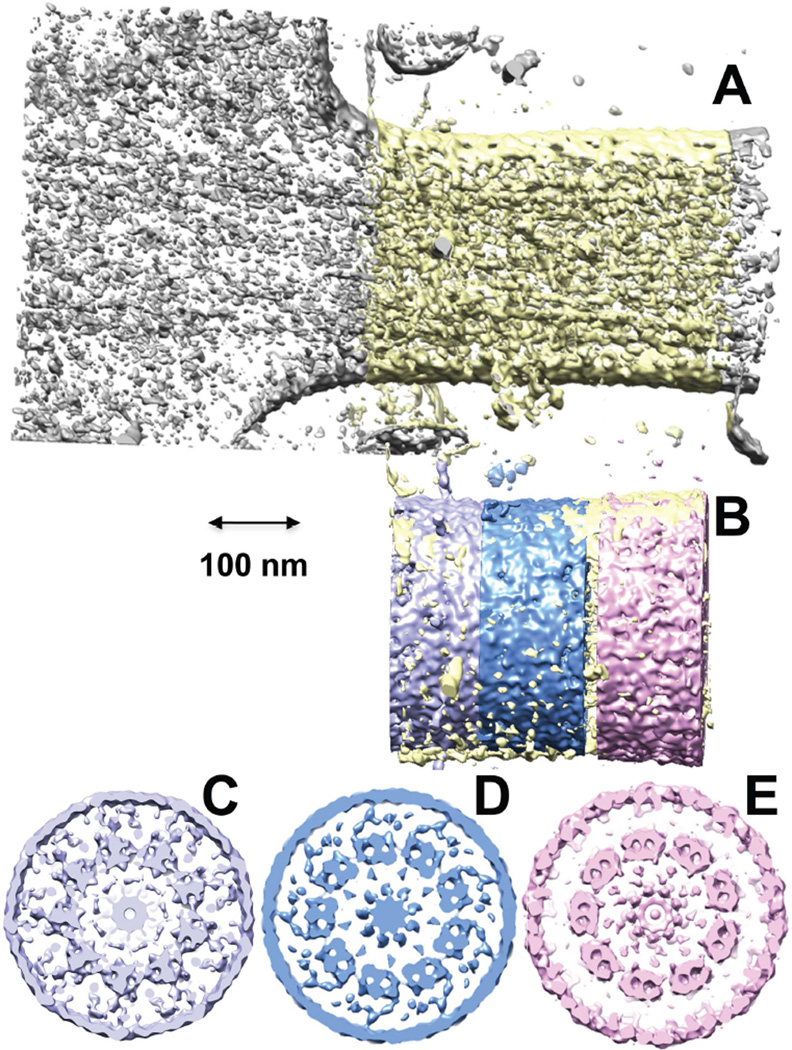
Figure 5.
Reconstruction of a transition zone/connecting cilium base from cryo-electron tomography (Cryo-ET) data, with sub-tomogram averaging used to enhance signal-to-noise. A. Tomogram with segmented region highlighted in light yellow. B. segmented version with color-coding of axial displacements; C-E, cross-sectional views of the maps resulting from sub-tomogram averaging of the nine microtubule doublets and membranes, with axial displacement of each section color-coded as in B.

