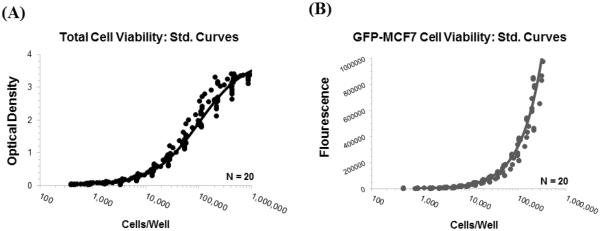
Figure 4.
Standard curve profiles generated to help calculate number of viable cells per well of a 96-well plate: (A) Observed (symbols) and model fitted (line) `optical density vs. cell number per well' profiles generated using MTT assay. (B) Observed (symbols) and model fitted (line) `fluorescence vs. cell number per well' profiles generated for GFP-MCF7 cells by measuring the extent of fluorescence per well.

